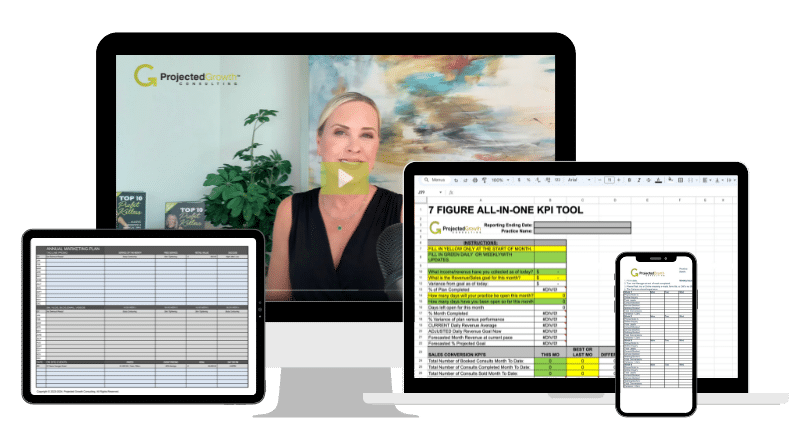
Med spa revenue alone means very little if your medical spa is leaking profits through idle rooms, high provider turnover, or unoptimized marketing spend. Many aesthetics practice owners operate partially blind, relying on month-end reports that arrive too late to fix real-time operational leaks. To scale your business to seven figures, you must transition from reactive management to proactive leadership driven by clean, real-time data.
Schedule Your Free Med Spa Growth Audit Today
Implementing a dedicated med spa KPI dashboard is the single most effective way to gain total visibility into your practice health. According to historical financial data across the 6,000+ aesthetic practices Projected Growth Consulting has worked with since 2011. Establishing a robust KPI dashboard yields an immediate 8% to 20% improvement in EBITDA within the first 12 months. This efficiency gain is unlocked without adding providers, expanding your treatment menu, or spending an extra dollar on marketing.
This guide walks you through the step-by-step process of building, automating, and running a med spa KPI dashboard that protects your profit margins and drives sustainable, scalable growth.
The short answer: A centralized med spa KPI dashboard gives you real-time visibility into the five operational pillars that determine your bottom line: financial health. Provider performance, patient acquisition, sales efficiency, and retention. Without one, you are flying blind with month-old data.
Many practice owners mistake their Electronic Medical Record (EMR) or Point of Sale (POS) system standard reports for a functional dashboard. While systems like Boulevard, Mindbody, or Zenoti collect massive amounts of data, they present it in isolated silos. They do not connect schedule density to provider payroll, nor do they map marketing campaign spend to patient lifetime value (LTV).
Operating a med spa without a centralized, cross-functional dashboard leads to expensive operational bottlenecks, including:
By compiling these critical operational layers into a single visual med spa KPI dashboard, you align your entire management team and providers around one source of truth. You gain the ability to spot performance drops on a weekly cadence and correct them before they impact your monthly profit and loss statement. For a deeper breakdown of what each KPI represents, refer to our guide on med spa KPIs and dashboard best practices.
The core KPIs every med spa needs fall into five operational pillars. A practical dashboard is not a wall of endless metrics. It is a curated set of 10 to 12 highly actionable indicators divided into distinct categories to maintain focus and prevent analysis paralysis.
Your dashboard must monitor these five essential pillars:
These five pillars form the foundation of every profitable med spa. The exact metrics within each pillar may shift as your practice grows, but the framework stays the same. For a deeper breakdown of what each KPI represents and how to calculate it, review our comprehensive Med Spa KPIs resource.
Benchmarks turn raw numbers into actionable signals. Without clear targets, your dashboard is just decoration. Your KPI targets should align with aesthetic industry standards and trigger specific operational responses when they fall outside acceptable ranges.
Based on aggregated data from thousands of aesthetic practices, your KPI targets should align with the benchmarks below. These metrics will tell you exactly where your practice stands and what to do next.
| KPI Metric | Target Benchmark | How to Calculate | Operational Action Trigger |
|---|---|---|---|
| Provider Utilization | 85% or higher | Actual Treatment Hours / Scheduled Working Hours | If below 70%, pause hiring and run a targeted re-engagement campaign. |
| Revenue Per Clinical Hour | $300 to $600+ | Total Treatment Revenue / Total Treatment Hours | If below $250, review your pricing strategy or audit provider cross-selling skills. |
| Consultation Close Rate | 50% or higher | Treatments Booked / Total Consultations Performed | If below 40%, enroll your front-desk and clinical staff in sales structure training. |
| Patient Rebooking Rate | 60% or higher | Patients Booked for Next Visit / Total Visits | If below 50%, audit your checkout process and enforce script-based rebooking. |
| LTV to CAC Ratio | 3:1 or higher | Customer Lifetime Value / Customer Acquisition Cost | If below 2:1, optimize your marketing spend and shift focus to high-retention services. |
These benchmarks are starting points. Your actual targets should be adjusted based on your specific market, service mix, and practice maturity. A startup med spa in a competitive metro area will have different realistic targets than an established practice with a loyal patient base.
Your dashboard tool should match your practice size, technical resources, and growth ambitions. There are three primary avenues for hosting your KPI dashboard, each with specific tradeoffs in implementation speed, cost, and maintenance burden.
Follow this structured sequence to go from raw data to a live dashboard that drives weekly decisions. Each step builds on the previous one, so do not skip ahead.
Start by selecting 10 to 12 KPIs from the five pillars above. Write down the exact definition for each metric so your entire team calculates it the same way. For example, “Provider Utilization” must be defined as actual treatment hours divided by total scheduled working hours, excluding lunch breaks and administrative time. Document these definitions in a shared operations manual.
Identify where each metric lives. Scheduling and sales data typically live in your EHR or POS system. Marketing spend and lead counts live in Google Ads, Meta Ads Manager, or your CRM (such as GoHighLevel). Overhead costs live in QuickBooks Online. Map every metric to its source system so you know exactly what needs to be connected.
If you are using Looker Studio or a custom BI tool, use native connectors or integration platforms like Zapier or Make to stream data automatically. Many modern med spa software systems offer open APIs that can automatically push nightly sales and booking data directly to your dashboard. Automation is the single largest predictor of whether your dashboard will still be in use six months from now.
Configure your dashboard to use green, yellow, and red alerts that instantly highlight whether each metric is on target, approaching a warning zone, or requiring immediate intervention. Use the benchmarks from the table above as initial thresholds and adjust based on your first 90 days of real data.
Set a two-tiered review cadence. Every Monday morning, the practice owner, manager. And lead coordinator should spend 15 minutes reviewing a condensed scorecard of lead volume, booking rates, consultation close rates, and provider utilization. Then, on the first week of each month, conduct a deep-dive review of your full financial metrics including net profit margins, COGS, payroll percentages, and patient lifetime value.
A dashboard is only valuable if it drives decisions. When a metric falls outside its target range, your dashboard must trigger a standardized operational response. Three common scenarios:
Scenario A: High lead volume, low consultation bookings. Your marketing is working, but your sales pipeline is broken. Check lead response times. If your team is taking longer than 15 minutes to follow up on inquiries, booking rates will plummet. Audit your front-desk booking scripts and lead routing protocols.
Scenario B: High revenue, declining net profit margins. Your business is active, but you are leaking profit. Audit your COGS and provider payroll. Ensure consumables are not exceeding 25% to 30% of treatment revenue. If payroll is high, your provider utilization is likely low, meaning you are overstaffed during slow hours.
Scenario C: High new patient counts, low rebooking rates. You are running a leaky bucket business, spending heavily to acquire one-time visitors. Implement a structured post-treatment follow-up sequence. Train injectors to pre-book the next treatment before the patient leaves the chair, and audit the clinical experience to ensure patient satisfaction is high. For additional guidance on patient retention frameworks, explore the MedSpa Growth Accelerator program.

Even a well-built dashboard will fail if you fall into these common traps. Awareness of these pitfalls will save you months of wasted effort.
Mistake 1: Tracking too many metrics. A dashboard with 30+ metrics is not a dashboard. It is a data dump. Stick to 10 to 12 actionable KPIs and resist the urge to add every interesting data point. If a metric does not directly inform a decision you would make this week, it does not belong on the dashboard.
Mistake 2: Skipping the data automation step. The number one reason med spa dashboards fail is the administrative burden of manual data entry. If someone on your team has to spend hours every week copying numbers, the dashboard will be abandoned within 90 days. Invest in automation upfront, even if it means delaying your launch by a week.
Mistake 3: Never reviewing the data. A live dashboard that nobody looks at is worse than no dashboard because it creates the illusion of control. If you do not have the discipline to hold a weekly 15-minute scorecard review, simplify your dashboard down to five metrics until the habit sticks. You can always add more later.
Mistake 4: Ignoring provider-level metrics. Many owners track practice-level revenue but miss provider-level profitability. One mid-level injector producing $200 per clinical hour while your top performer produces $600 represents a massive gap. Share individual provider metrics like revenue per clinical hour, utilization, and retail attachment rate to foster healthy competition. Keep high-level financial data (like net profit margins) restricted to ownership and management.
If you use a ready-made tracking tool like PGC’s pre-configured KPI sheets and Growth Hub templates, setup takes less than two hours. Building a custom Looker Studio or Power BI dashboard with automated API pipelines typically takes 10 to 15 hours of technical configuration. A structured spreadsheet can be ready in about four hours but requires weekly manual updates.
For a fully automated system, you should connect your EHR/POS system (such as Boulevard or Zenoti). Your marketing platforms (Google Ads, Meta Ads Manager), your CRM, and your accounting platform (QuickBooks Online). Most modern EHR systems offer API access that enables automated nightly data syncing.
Real-time financial and scheduling data should sync daily through automated pipelines. Your weekly scorecard review should happen every Monday morning without exception. The full monthly strategic review should be scheduled for the first week of each month and treated as a non-negotiable management meeting.
The industry benchmark for provider utilization is 85% or higher for full-time injectors. Rates below 70% indicate you are overstaffed relative to patient demand. At that threshold, pause any new provider hiring and run a targeted re-engagement campaign to fill open appointment slots before adding more clinical capacity.
Yes, selectively. Sharing provider-specific metrics like revenue per clinical hour, utilization, and retail attachment rate fosters healthy competition and accountability. Clinical staff should have visibility into their individual performance metrics, while high-level financial data such as net profit margins remains restricted to ownership and management.
The Projected Growth Practice OS includes a complete KPI tracking module with pre-configured benchmarks, automated data connectors, and template scorecards. It integrates directly with the Growth Hub membership model to give you a unified system for operational tracking, strategic planning, and team accountability.
Building a med spa KPI dashboard is the essential first step toward operational freedom and seven-figure profitability. However, tracking the numbers is only half the battle. You must also know how to execute the operational shifts required to hit those benchmarks.
At Projected Growth Consulting, we have helped over 6,000 aesthetic practices streamline operations, maximize margins, and achieve predictable growth. Through our high-ticket MedSpa Growth Accelerator (MGA) program and personalized Executive Coaching, we provide the precise frameworks, KPI tools, and professional guidance you need to scale with confidence.

Written by
Founder & CEO, Projected Growth Consulting
Kelly Smith is a med spa business consultant with 20+ years of industry experience and the founder of Projected Growth Consulting. A former 7-figure med spa owner, published author of 5 books, and international speaker, Kelly has helped 6,000+ practices generate over $250 million in additional revenue through proven growth strategies.