Many med spa owners run seven-figure practices while taking home almost zero profit. They spend thousands on marketing and equipment but cannot explain where their cash goes. This painful financial drain is the direct result of revenue blindness.
A med spa profit scorecard is a financial tracking tool that maps your true margins across service categories, staff performance, and operational costs. By tracking marketing, sales, operations, and finance, this tool exposes hidden cash leaks that cost many practices up to thirty percent of their profit. Instead of guessing with raw sales reports, you track exact metrics like product costs and clinician hours to find the true value of every treatment. This simple model helps you spot unprofitable services, stop wasting cash on bad marketing, and make hiring decisions based on real, objective numbers. Industry data from Boulevard shows that top-performing practices reach forty percent profit margins by tracking these key details.
How do you move from financial confusion to total control over your cash flow? We will start by exposing the real dangers of running your practice without these vital numbers. To stop the bleeding and scale your business, the path begins below.
Many medical spa owners run their business with a blind spot. They see strong sales and believe their practice is healthy. But top-line sales do not tell the whole story.
The average single-location med spa makes between 1.4 million and 2 million dollars in annual revenue. Yet, many of these owners do not know their true profit margins. They focus on total sales while ignoring the actual cash they keep. This blind spot can cause massive stress.
A new aesthetic clinic costs a lot of cash to start. The cost to open a med spa can range from 200,000 to over 1 million dollars. Owners invest this cash because the industry is booming.
In fact, the global med spa market reached about 18.6 billion dollars in 2024. Industry experts expect this market to grow at a rate of 15.13% each year through 2030. The global market grows fast toward a projected 45 billion dollars by 2030, based on research from EHL Insights. But many owners still struggle to build a stable business.
Most owners track daily sales and think they are doing well. They look at a busy waiting room and feel they are winning. But this view is a dangerous trick. They do not know which services or providers bring real profit.
For instance, a common laser treatment might have high costs and thin margins. Meanwhile, a less common service might have very low costs and high profit. Without clear data, you might promote the wrong service. This lack of detail is called revenue blindness.
This blindness comes with a heavy price. Experts say these blind spots cost typical practices between 15% and 30% of their profit each year. These leaks happen because owners do not know where their sales come from.
For instance, data from the Zenoti 2025 Benchmark Report shows that 42% of loyal guests drive 80% of total revenue. If you do not track this group, you cannot protect your main source of income. You might waste marketing dollars on new leads while ignoring your best guests.
To fix these leaks, you need a solid tool to track your metrics. You cannot rely on hope or guesswork to run a strong practice. This is where a custom med spa profit scorecard becomes vital.
Made by Kelly Smith and her team, this tool is a core part of the Practice OS system. It shines a light on your true margins by service and provider. Instead of feeling blind, you gain clear sight of your business health.
A med spa profit scorecard is a structured tracking system that shows your real profitability at every level of your business. It is not a simple sales report. It goes deeper to show you which services, providers, and marketing channels actually generate profit. The Practice OS Scorecard methodology divides this data into four essential quadrants.
The Marketing quadrant tracks your return on investment by channel and your cost per new client. Without this data, you might spend thousands on ads that bring in low-value clients. The Sales quadrant tracks your conversion rates, average ticket size, and upsell rates. These numbers show you how well your team turns leads into paying clients.
The Operations quadrant monitors provider utilization rates, treatment room efficiency, and supply costs per service. If your providers sit idle or your supplies are wasted, this quadrant catches it. The Finance quadrant shows your revenue by service, your profit margin by service, and your overhead allocation. This is where you spot the true winners and losers on your menu.
Knowing the numbers is useful only when you have something to compare them against. Industry data gives your scorecard meaning. The average profit margin for medical spas is about 20% to 25%, according to estimates from Zenoti. The American Med Spa Association reports a similar average of 29%, as cited by Irvine Bookkeeping.
Top-performing practices reach 30% to 40% margins. These are the clinics that track their data and act on it. Smaller or newer med spas typically operate at 10% to 15% margins while they build their client base. Your scorecard tells you where you fall on this spectrum and what to do about it.
The Practice OS Scorecard brings all this information into one clear view. Instead of chasing top-line revenue, you focus on bottom-line profit. That shift changes everything about how you run your business.
To build a strong med spa profit scorecard, you must first find where your cash is slipping away. Gaps in revenue visibility cost most spas 15% to 30% of their profits each year. You cannot fix what you cannot see. By using Kelly Smith’s Projected Growth Practice OS, you turn a leaky business into a tight, profitable engine.
You must pull raw data from your main software tools before you can spot the leaks. Begin by pulling your main financial files from QuickBooks. Next, look at your practice management software.
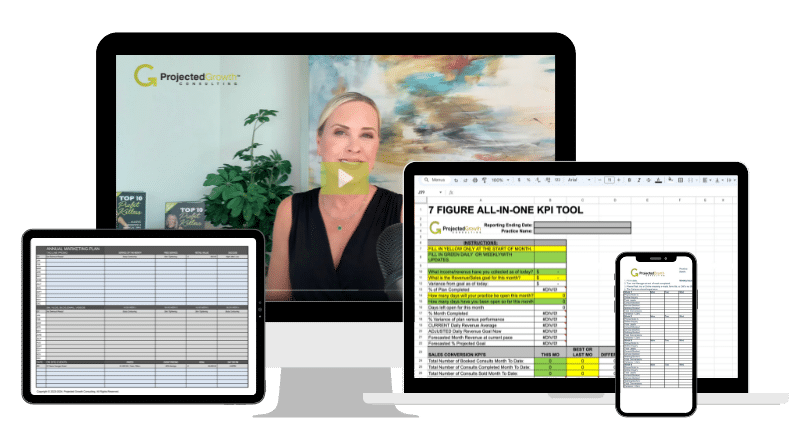
Last, open your 7-Figure KPI Tracker to see where the numbers do not match. When you track these metrics over time, you build a clean history of your clinic. This step is key for building a med spa profit scorecard that keeps your team on track.
The global med spa market is growing fast and may hit high sales by 2030, as shown by EHL Education. But as your practice grows, your daily costs will also rise.
Without a clear profit scorecard, you might make more sales but still take home less cash. You must track where your funds go to protect your bottom line. This data lets you stop guessing and start leading with facts.
We have found five major areas where med spas lose money. Use your scorecard to audit these points each week. By reviewing these numbers, you can spot and plug each leak before it drains your bank account.
You cannot run a strong practice on total sales alone. To build a robust med spa profit scorecard, you must know the exact margin of each service. Many owners do not know which treatments make money and which ones lose it. A service-level model breaks down every treatment by its true costs and returns so you can make smart choices.
To find your real margins, you must track four main cost areas for every service you offer. First is the price per unit, which is what the client pays. Second is the direct cost of goods, including injectables, serums, and key supplies. Third is the labor cost, which covers provider hourly pay and any commissions. Last is shared overhead, which is your rent, software, and utility cost split by treatment time. You must add each of these items to get an accurate view.
Knowing these four metrics helps you set your pricing for sustainable profit. Without this clear breakdown, you may underprice complex work. Every supply item and minute of staff time must be in your math to avoid hidden losses. Once you have these costs, you can plan your menu with high-profit items at the center.
For instance, when you perform dermal filler, your direct cost is high because of the syringe price. But a laser treatment has very low direct cost after you buy the machine. Your scorecard tracks these gaps so you know where to focus your sales efforts.
Top medical spas aim for margins of 30% to 40% on their main services. But not all treatments yield the same returns. In fact, low-revenue, high-margin services often help pay for high-revenue, low-margin ones. For example, a quick skin prep might have huge margins but small total sales. On the other hand, complex device work may bring in large check sizes. But it often has tight margins due to lease costs and labor. You must know this mix to keep your business healthy.
As demand for aesthetic medicine grows, you must balance these two service types. If you only sell low-margin treatments, your cash flow will suffer. Your scorecard should highlight this mix so you can push the right treatments to hit your goals. This balance is key to building a business that lasts.
The table below shows sample figures for common treatments. It compares the revenue, costs, and margins for four services to guide your model.
| Treatment Type | Price per Session | Direct Cost | Labor and Overhead | Net Margin |
|---|---|---|---|---|
| Botox (per syringe) | $600 | $240 | $180 | 30% (Low Margin) |
| Dermal Filler | $800 | $300 | $260 | 30% (Moderate Margin) |
| Laser Treatment | $400 | $40 | $160 | 50% (High Margin) |
| IV Therapy | $200 | $30 | $90 | 40% (High Margin) |
Once you have identified your leaks and modeled your service margins, you need a system to keep the scorecard alive. These final three steps turn raw data into daily business actions that protect and grow your profit.
Use the 7-Figure KPI Tracker to build a live dashboard that pulls fresh data each week. Connect it to your QuickBooks accounts and practice management software. Your dashboard should show the five to seven metrics that matter most: revenue per service. Profit margin per service, client retention rate, average ticket size, and provider utilization rate.
Do not overload the dashboard with every data point available. Pick the few numbers that directly reflect your financial health. When these move, you know something needs attention. Update the data every Monday morning so you start each week with a clear picture.
Block 30 minutes every week for your scorecard review. Sit down with your key team members and walk through each metric. Compare actual results to your targets. Ask one question for each number: what moved, why did it move, and what is one action we take because of it?
This weekly habit is what separates the top 10% of practices from the rest. It creates a culture of financial accountability. Every team member knows the numbers and understands how their work affects them. Over time, the 30-minute review becomes the most valuable meeting of your week.
Set clear thresholds that trigger specific actions. When the profit margin on filler drops below 25%, flag it for a pricing review with your team. When your no-show rate exceeds 8%, escalate to front-desk retraining on deposit policies. When any service stays below target margin for two months, evaluate whether to adjust pricing or retire the service.
These triggers turn your scorecard from a passive report into an active management tool. Projected Growth Consulting clients who use this system see an average of 30% growth in 90 days, according to documented results from the Practice OS system. Link to the cash flow management guide and the full Practice OS operations system for deeper implementation support.
Your Practice OS Scorecard methodology does more than find small leaks. It gives you a permanent tool to make better business choices. When you track the right numbers every week, you see patterns that most owners miss. This clarity helps you grow faster and build a practice worth selling.
With a profit scorecard in place, you can compare your margins to real data. The average med spa owner makes a salary between $280,000 and $500,000 per year. Top performers reach profit margins of 30% to 40% per year, as reported by Boulevard. If your scorecard shows lower margins, you now have a clear signal to adjust your pricing, service mix, or operating costs.
Industry data from Zenoti shows that 42% of loyal guests drive 80% of total revenue. A scorecard helps you identify and protect that core group. You can track retention rates, average spend per repeat client, and lifetime value – three numbers that predict long-term health far better than daily sales.
Your scorecard answers the hard questions. Which services should you promote this month? Which providers need coaching? Should you raise prices or cut costs? Without hard data, these decisions are guesses. With a scorecard, each choice is backed by real numbers from your own practice.
The scorecard also reveals growth opportunities. If laser treatments show 50% margins but low volume, you can invest in a targeted campaign. If filler margins are dropping, you can renegotiate supply costs or adjust pricing. Every decision becomes a calculated move instead of a hope.
A practice that tracks and acts on its data is worth more at sale time. Buyers pay a premium for businesses with clean financial records, documented margins, and repeatable systems. Your profit scorecard creates this evidence. It proves your practice runs on discipline, not luck.
Kelly Smith’s Projected Growth Practice OS was built for this purpose – not just to improve monthly profit, but to build a sellable asset. When the scorecard is part of your weekly rhythm, it becomes a core part of your operations system. Any buyer can understand and trust it.
According to the American Med Spa Association, the average profit margin for medical spas is about 29%. However, top practices often reach margins of 30% to 40% by tracking their data. Newer or smaller clinics usually start with lower margins of 10% to 15% as they build their client base.
You should update your profit scorecard every week to catch cash leaks before they grow. Waiting for end-of-month reports means you are looking at old data that you can no longer change. Weekly tracking helps you spot drop-offs in sales, high supply costs, or low staff hours in real time so you can adjust.
Yes, new medical spas should use this system from day one. Setting up your scorecard early builds strong habits and prevents the common financial blind spots that sink new businesses. By tracking marketing, sales, operations, and finance right away, you ensure your new practice has a clear, proven path to reaching 7-figure sales.
Yes, the industry is expanding rapidly. Market data from EHL Insights valued the global medical spa market at 14.4 billion dollars in 2022. It is projected to reach 45 billion dollars by 2030. This growth means there is massive opportunity for practices that run efficiently.
Kelly Smith and the Projected Growth Consulting team have helped med spa owners across the country build their profit scorecards as part of the Practice OS system. You can schedule a free consultation to learn how the Growth Hub and Practice OS Scorecard can uncover hidden cash flow in your practice. The data is waiting. All you need is the right system to see it.

Written by
Founder & CEO, Projected Growth Consulting
Kelly Smith is a med spa business consultant with 20+ years of industry experience and the founder of Projected Growth Consulting. A former 7-figure med spa owner, published author of 5 books, and international speaker, Kelly has helped 6,000+ practices generate over $250 million in additional revenue through proven growth strategies.